The spring and summer are viewed as the perfect time to go on a vacation in Asia. Almost all countries in the Apac region indicate a spike in tourism and sales starting in April. Such countries include the cherry blossom trio – China, Japan, and South Korea – as well as Singapore, the Philippines, and Indonesia – mostly Bali.
This article will go over the trends of 2025 that businesses should expect considering the influx of tourists. This is the best opportunity to advertise your companies in the Asia-Pacific region, especially if your industry is B2C, though B2B companies should also stay up to date with the most recent 2025 trends.
Apac trend number 1: Increasing revenue of the tourism industry
The Apac region is expected to generate 305 billion USD in 2025 with a promising 4.39% annual increase. The tourism industry in the Asia-Pacific region is divided into 5 main categories:
- Hospitality – hotels, hostels, and other forms of traditional accommodations;
- Package Holidays – all-inclusive trips organized by travel companies, covering accommodation, meals, transportation, and activities;
- Vacation Rentals – privately owned homes and apartments rented out through platforms such as Airbnb;
- Camping & Outdoor Stays – a broad category that includes both traditional camping – tents – and modern camping – RV parks and Caravans;
- Cruises – While less popular in APAC compared to Europe or North America, the cruise industry still holds a percentage of the market share.
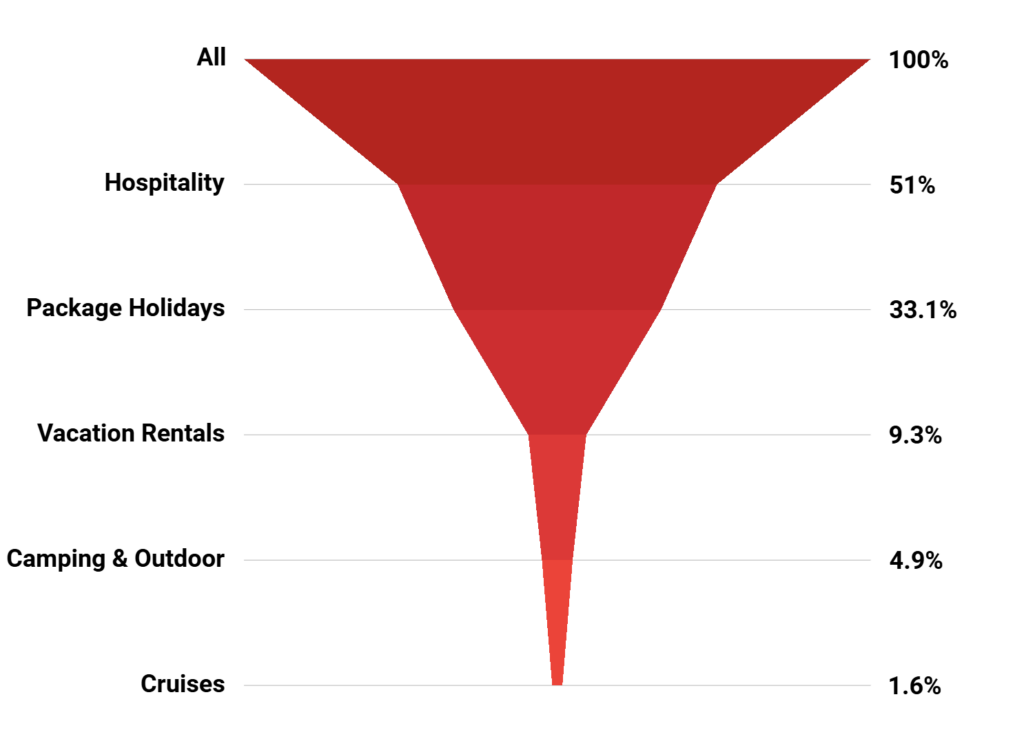
The funnel graph illustrates the market share of the aforementioned categories. This trend remains the same in all countries that will be discussed in this article – China, Japan, South Korea, Singapore, the Philippines, and Indonesia – with hospitality holding the biggest share and cruising the lowest.
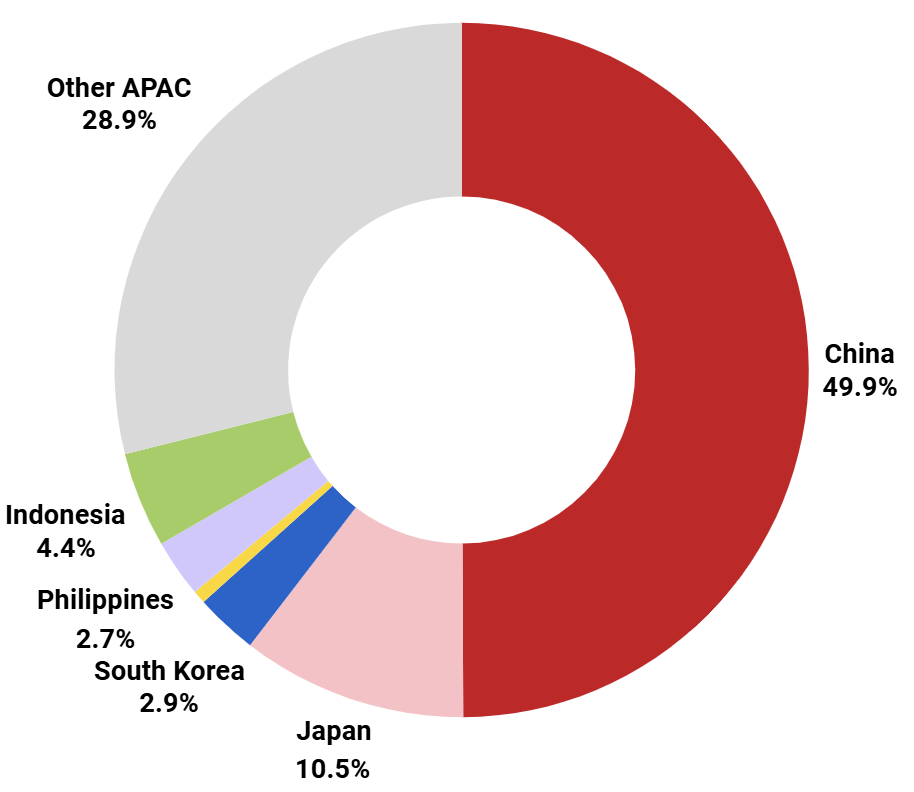
Apac trend number 2 – Rising popularity of Asian tourism
Each year about one billion people enter the Apac region. In 2025, this number is expected to be 910 million people, 8.5% more than the previous year. The pie chart below illustrates the breakdown of the countries that will be discussed in this article:
- China – 454 million people;
- Japan – 96 million people;
- South Korea – 26 million people;
- Singapore – 6 million people;
- the Philippines – 25 million people;
- Indonesia – 40 million people.
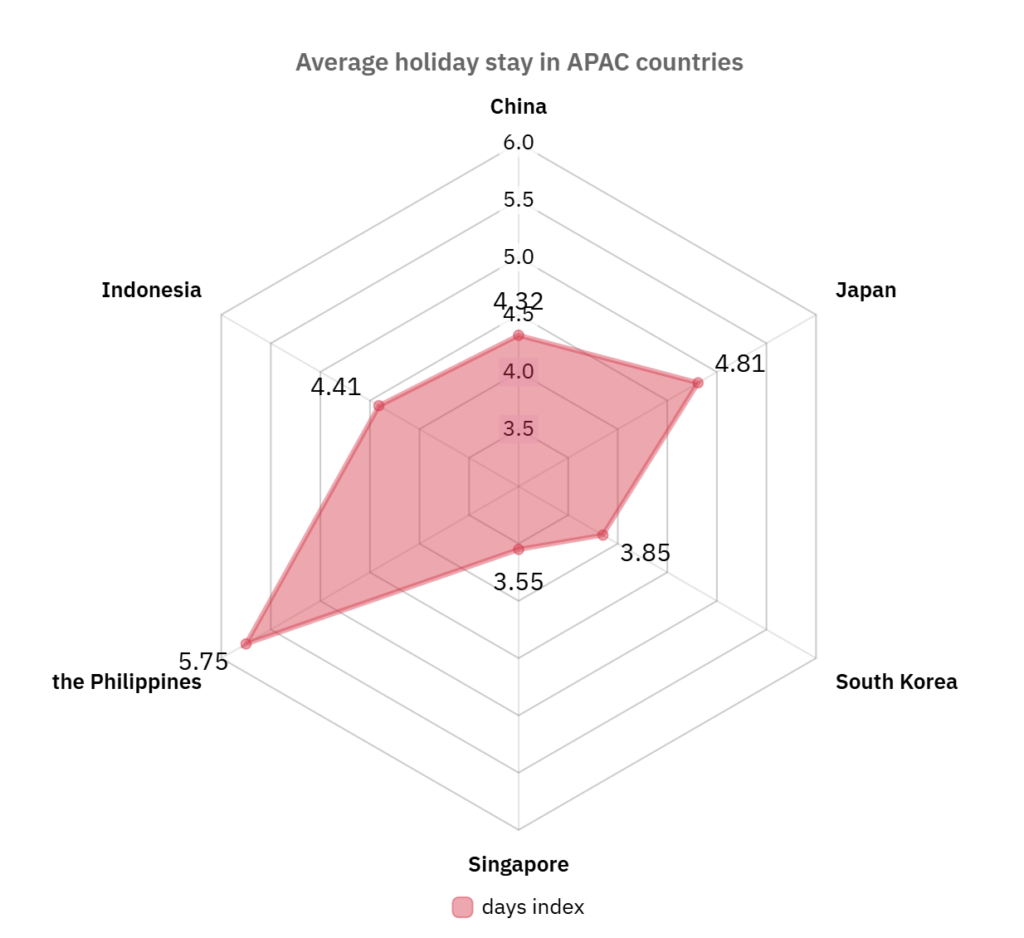
Average vacation stay length per country
Despite the popularity of the Asia-Pacific region, not all countries indicate a rise in popularity. South Korea, Singapore, and the Philippines have been slowly losing – and are forecasted to continue losing – popularity. China, Japan, and Indonesia are continuing their upward trend.
- Negative
The average holiday stay in South Korea in 2025 is 3.87 days with an annual decrease of 0.015 in the index. Going from 3.97 pre-COVID to an expected 3.81 in a couple of years.
Singapore’s decrease is a rather steady one, as the country plateaus every 3 years. The average stay in 2025 is the same as 2024 – 3.55 days, and it is not expected to decrease by 0.02 until 2027.
Likewise, the Philippines has also indicated a plateau phase, though for a period of 4 years. The average stay in 2025 is the same as just after covid – 2021, and it is not expected to decrease by 0.01 until 2026.
- Positive
Japan is the Apac country affected the most by COVID, as the average stay went from 4.81 to 4.78 in just 1 year. In 2025, the average stay has resumed to 4.81 and is expected to increase to 4.83 in 2030.
Both China and Bali (Indonesia) have been steadily increasing and have not been affected by COVID, unlike Japan.
China has a growth rate of 0.04 and the average vacation stay is expected to increase from 4.32 in 2025 to 4.52 in 2030.
Likewise, the average stay in Indonesia is expected to grow from 4.41 in 2025 to 4.67 in 2030 – an annual index growth rate of 0.05.
- Comparison
Despite the decreasing trend, the Philippines is still the country with the lengthiest holiday stay. However, Singapore – an Apac country also showing a decreasing trend – holds the lowest position. The country with the biggest long-term market promise is Indonesia (mostly Bali) as it holds the highest growth rate of 0.05 among the countries.
The overall Apac region comparison is indicated in the graph below:
Travelling purpose – business trip or casual
The foreigners who go to China, Japan, South Korea, and the Philippines follow the general pattern of predominantly leisure trips with about 15% of all trips accounting for business. However, Singapore and Indonesia are the exception, as only 4% of all foreigners who enter do so because of a business purpose.
This disparity can be explained by the other trends in this article, such as the spending habits and the general demographic of the tourists.
Tourists’ spending habits
Apart from accommodation spending, the tourists also allocate their budget towards food, clothing items, activities, and souvenirs.
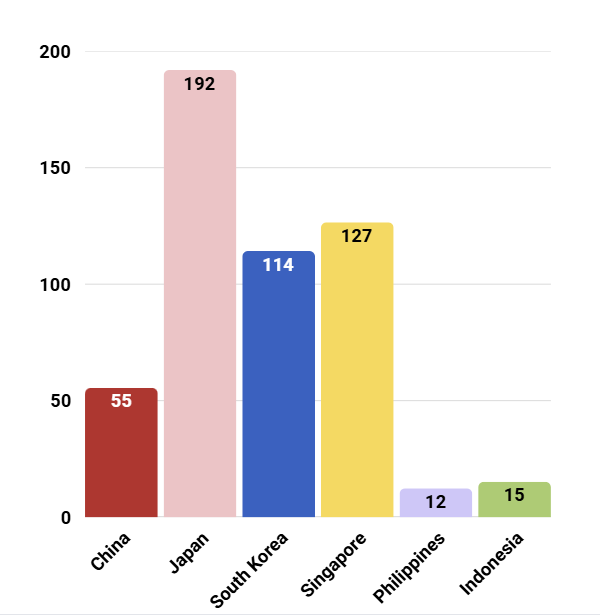
(Information derived from Statista, 2025)
The chart illustrates the daily average spending of a tourist in 2025. As seen in the chart, the APAC countries are divided into 2 categories:
- Japan, South Korea, and Singapore – the countries with a cost of living that is similar to the USA, as the prices are in USD;
- China, the Philippines, and Indonesia – countries whose currency is very weak compared to USD.
Apac trend number 3: Rise of luxury tourism
Income
Most people traveling across the Apac region indicate that they have a high annual income. Those tourists account for the biggest share across all countries being analyzed in this article. However, the highest concentration of such people resides in Indonesia (53%) and the Philippines (51%). The third highest market is Japan at 46%. South Korea has the lowest percentage of high-income tourists at 36%, only slightly surpassing medium-income tourists at 34%.
Age
The Apac region does not have an age trend that encompasses all countries, thus, each one has to be viewed separately.
- China – Most tourists who go to China are between the ages of 25-34 – accounting for 30% of all tourists. The second most attractive tourist age is 35-44, as they hold about 26% of the total number. Unlike the other countries in the Asia-Pacific region, China is not preferred by the elderly, as only 7% of all tourists are between the ages of 55-64.
- Japan – Most tourists who visit Japan are elderly. The biggest age demographic is 45-54 at 25%, followed by 35-44 at 22% and 55-64 who hold 19% of the total number.
- South Korea – This is the country with the most even split between the demographics. All age groups hold about 22% of the total, with the highest portion being allocated for tourists between the ages of 45-54 at 23%.
Due to this split, it is difficult to advertise in this region, thus, if you are a business owner, you should hire people with expertise in this field, such as InterAd. - Singapore – The county’s tourists are predominantly (27%) between the ages of 25-34. The second highest demographic group is 35-44 at 24% of the total number followed by 55-64 at 17%.
- The Philippines – This is the country with the highest percentage of young adult tourists (18-24) who make up 23% of all. However, they are not the biggest group as those between the ages of 25-34 hold 43% of the total number.
- Indonesia – Likewise the Philippines, Indonesia also has a high percentage of young adult travelers (18-24) who make up 19% of the total. However, the biggest demographic groups are those for the ages of 25-34 and 35-44, holding 37% and 31% of the total respectively.
Gender
The cherry blossom trio – China, Japan, and South Korea have a pretty even split of 50-50 male to female ratio. However, Singapore, the Philippines, and Indonesia all indicate a trend of increased male traffic. Singapore shows the highest discrepancy, as the male-to-female ratio is at 56:44; the Philippines and Indonesia indicate ratios of 53:47 and 52:48, respectively.
Conclusion
After reading this article, you are now more familiar with the 2025 tourism trends in Asia, with an emphasis on China, Japan, South Korea, Singapore, the Philippines, and Indonesia (Bali).
To sum up the key details:
- The tourism industry in 2025 is worth 305 billion USD and has a 4.39% annual growth rate. The main revenue streams are 5 with the biggest one being “Hospitality” which holds 51% of the market share.
- Each year, more than 910 million people enter this region, with an 8.5% growth rate of interest in Apac tourism.
- The average holiday stay varies from country to country. The Philippines has the highest one – 5.75 days, and Singapore has the lowest – 3.55 days. Half of the countries indicate a growing trend (China, Japan, Indonesia), and the other half a decreasing trend (South Korea, Singapore, and the Philippines).
- Most people travel for leisure rather than for business.
- Tourists spend an average of 86 USD per day with Japan having the highest daily average – 192 USD, and the Philippines the lowest – 12 USD.
- Most tourists traveling to Asia are male, indicate that they have a high yearly income, and are predominantly between the ages of 25-44.
If you would like to advertise your company in South Korea, make sure to contact the experts at InterAd, as they have even more knowledge than what is written here.
Continue reading about APAC trends:
- APAC E-commerce in 2025;
- APAC Consumer Trends in 2025;
- APAC Mobile Gaming Marketing in 2025;
- APAC TikTok Marketing in 2025.